User Interface Overview
Main Toolbar
At the top of the window, the main toolbar contains most of the program controls. Depending on the current state of the program, not all of these controls are active.
Acquireopens a menu with options for initiating a new experiment.Start Experiment(hotkey: F2) opens a wizard for fully configuring a new experiment.Quick Experiment(hotkey: F3) allows repeating a previous experiment or initializing the “Start Experiment” wizard with settings from a previous experiment.Start Sequenceperforms a series of identical experiments with a time delay in between.
Hardwareopens a menu that provides access to hardware object controls and settings, as well as the instrument’s Rf/MW configuration. These are discussed in greater detail on the Hardware Menu page.Rolling DataandAux Dataare menus with settings pertaining to the Rolling/Aux Data tabs. Here you can control the number of plots on each tab and, for rolling data, the minimum amount of retained history.View Experimentloads and displays any previously-completed experiment in a new window.Settingscontains miscellaneous program settings, including the program Data Storage Location.
On the far right are additional controls that are most relevant during an acquisition:
Pausesuspends data processing during an active experiment. Any FIDs coming from the FTMW digitizer are discarded and no Aux Data is recorded while the acquisition is paused.Resumecontinues data processing as usual after an experiment has been paused.Abortterminates an ongoing acquisition. For “Peak Up” and “Forever” FTMW acquisition modes, pressing the abort button is the normal way to stop the experiment.Sleepplaces Blackchirp and its hardware into a standby state. If this button is pressed during an acquisition, Blackchirp will enter sleep mode when the experiment completes. Each piece of hardware can interpret sleep mode in its own way. At present, a PulseGenerator will stop generating pulses, and a FlowController will shut off all gas flows (but the actual flow rates will continue to be monitored). Other hardware objects do nothing.
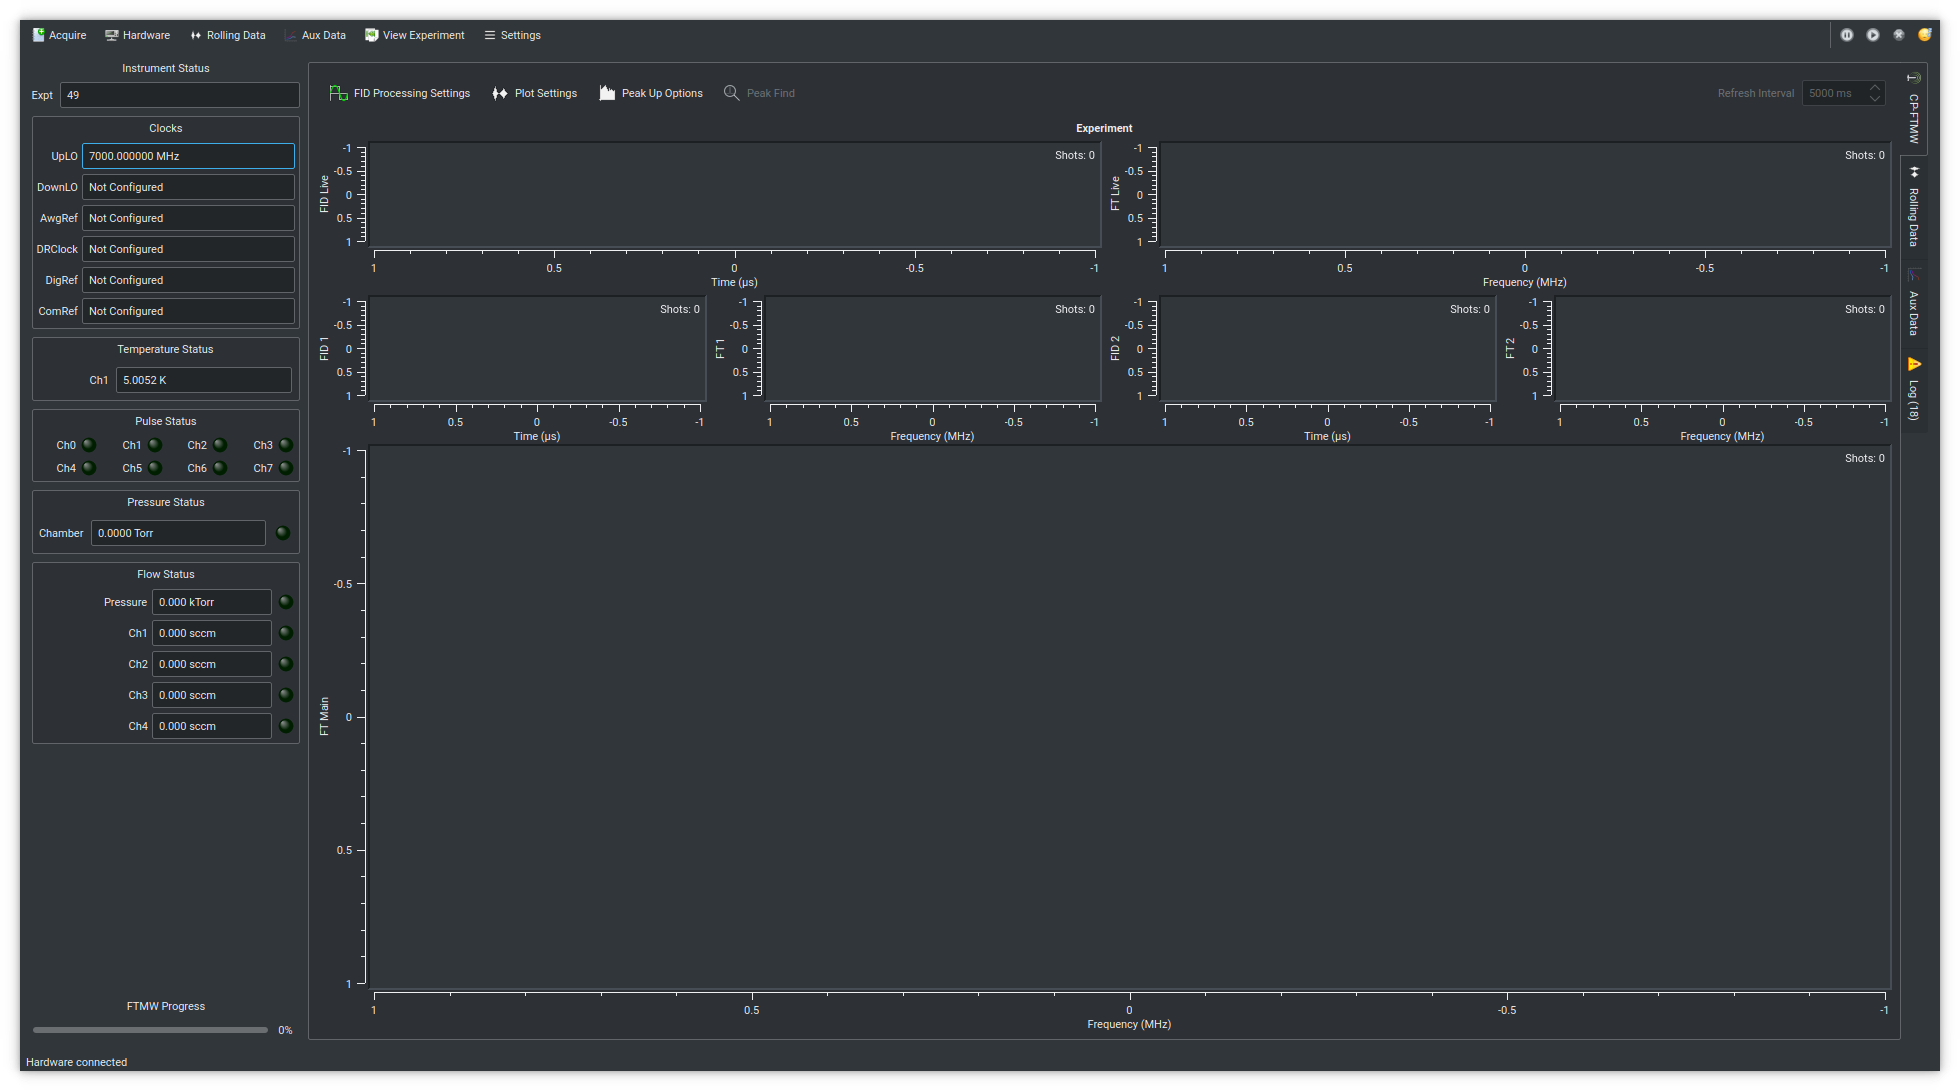
Instrument Status
The left side of the user interface shows the current instrument status, including the most recent readings from hardware that is periodically polled. Depending on your hardware configuration, some of these boxes may not be present.
Exptdisplays the last experiment number in the current save directory, or 0 if no experiments have been performed. The number increments upon successful initialization of an experiment.Clocksshows the current frequencies of the oscillators that have been configured. Upon program startup, all physical clocks that are assigned to clock roles are read and the frequencies updated. For FixedClocks, the frequency will be recalled from the previous Blackchirp instance. See the Hardware Menu page for more details on the clock roles.Hardware Statusboxes show the most recent reading(s) for the respective hardware, and/or LEDs that indicate whether a particular channel is active. For instance, if a TemperatureController is enabled, the Temperature Status box will show the readings of all enabled channels, while if a PulseGenerator is enabled, then the Pulse Status box shows which channels are currently enabled. A FlowController, on the other hand, always shows the readings of all channels, and LEDs are used to indicate whether a channel is enabled.FTMW Progressshows the completion percentage of an ongoing FTMW acquisition.LIF Progressshows the completion percentage of an ongoing LIF acquisition (if the LIF module is enabled).
Display Tabs
The majority of important information is displayed in a tabbed interface in the center of the UI.
CP-FTMWshows free-induction decay and Fourier transform data from an ongoing or just-completed experiment. More information about the plots and controls on this tab is available on the CP-FTMW Tab page.LIFshows data from an ongoing or just-completed LIF experiment. More details can be found on the LIF module page.Rolling DataandAux Databoth show signals from hardware items recorded as a function of time. “Rolling” data is acquired continuously while Blackchirp is open, while “Aux” data is recorded only during an experiment. More details are provided on the Rolling/Aux Data page.Logshows program-related messages, including warnings and errors. The number of new messages shown since the last time the tab was viewed is displayed in parentheses. Any warnings are indicated with a yellow triangle icon on the tab, and errors are indicated with a red and white “X” icon. When an error occurs, additional information about the cause can be found here. All log messages are recorded to disk in a semicolon-delimited file format under the “log” folder in the current save path. A single log file contains all messages during a given month of program execution. Additionally, any log messages received during an experiment are stored in the same format aslog.csvin the experiment’s data folder.