Data Storage
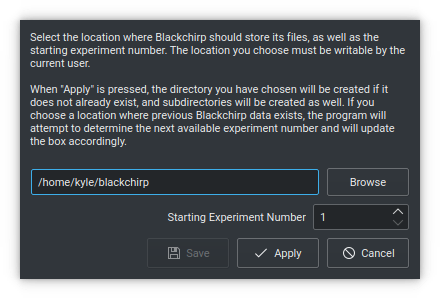
Blackchirp stores its data in your selected Data Storage Location. The location may be changed by selecting the Settings > Data Storage menu item.
At this location, Blackchirp creates 4 subfolders:
experiments: Storage for experiment data files. A more detailed description is below.
log: Location of program log files. All messages that were displayed on the log tab are written in CSV format, and a new CSV file is generated each calendar month.
rollingdata: CSV files containing monitoring data (see Rolling and Aux Data)
textexports: Default location for XY export files for graph data.
All of Blackchirp’s data files are written in plain-text CSV format using a the separator character ;.
Experiments
Each experiment that Blackchirp performs is associated with an experiment number, and the location of its data files within the experiments folder is derived from that number. To avoid having an excessive number of directories at a single level, Blackchirp collects experiments in groups of 1000 and stores each group under a single directory. For a given scan number X, its data will be stored in the directory experiments/Z/Y/X, where Z = X//1000000 and Y = X//1000 (integer division, discarding remainder). For example, experiment 123456789 would be stored in directory:
experiments/123/123456/123456789
and experiment 480 would be stored in:
experiments/0/0/480
Each experiment is associated with several CSV files that contain information about aspects of the experiment.
auxdata.csv
This file contains all auxiliary data collected during the experiment, which is plotted on the Aux Data tab. Aux data is collected at fixed time intervals throughout the experiment as determined by the “Aux Data Interval” option on the Experiment Setup page. Example:
timestamp;epochtime;elapsedsecs;Ftmw.ChirpPhaseScore;Ftmw.ChirpShift;Ftmw.Shots
Tue Dec 13 17:48:08 2022;1670982488;0;0;0;0
Tue Dec 13 17:48:13 2022;1670982493;5;0;0;8
Tue Dec 13 17:48:18 2022;1670982498;10;0;0;18
Tue Dec 13 17:48:23 2022;1670982503;15;456170656;-1;28
Tue Dec 13 17:48:28 2022;1670982508;20;483896352;-1;36
Tue Dec 13 17:48:33 2022;1670982513;25;462966016;-1;46
The format is similar to the Rolling Data format, with two exceptions: first, there is an additional elapsedsecs column that tells the number of seconds since the start of the experimment, and second, there may be many columns of data.
chirps.csv
This file contains information about the CP-FTMW chirps. A single chirp may be built from multiple segments (any of which may be empty), and each segment has a starting frequency, and ending frequency, and a duration. An entire experiment may consist of many differnt chirps. The example below shows an experiment in which a gas pulse was probed by a series of 20 identical chirps:
Chirp;Segment;StartMHz;EndMHz;DurationUs;Alpha;Empty
0;0;4895;1520;1;-3375;false
1;0;4895;1520;1;-3375;false
2;0;4895;1520;1;-3375;false
3;0;4895;1520;1;-3375;false
4;0;4895;1520;1;-3375;false
5;0;4895;1520;1;-3375;false
6;0;4895;1520;1;-3375;false
7;0;4895;1520;1;-3375;false
8;0;4895;1520;1;-3375;false
9;0;4895;1520;1;-3375;false
10;0;4895;1520;1;-3375;false
11;0;4895;1520;1;-3375;false
12;0;4895;1520;1;-3375;false
13;0;4895;1520;1;-3375;false
14;0;4895;1520;1;-3375;false
15;0;4895;1520;1;-3375;false
16;0;4895;1520;1;-3375;false
17;0;4895;1520;1;-3375;false
18;0;4895;1520;1;-3375;false
19;0;4895;1520;1;-3375;false
The first column (Chirp) is an index identifying the chirp, and the second (Segment) identifies which segment of the chirp is being described. In this experiment, each of the 20 chirps consists of only a single segment starting at 4895 MHz and ending at 1520 MHz, with a duration of 1 microsecond. The Alpha column is the sweep rate in MHz/μs. If the Empty column is true, then the start end end values are ignored, and the segment contains just 0 over the indicated duration.
Note
The frequencies and sweep rate contained in the chirps.csv file refer to AWG frequencies. The actual chirp range depends on the Rf Configuration.
clocks.csv
This file contains the configuration of the clocks (upceonversion LO, downconversion LO, etc) as discussed on the Rf Configuration page. In a typical CP-FTMW experiment, each clock is set to a single value, but in some cases (e.g., an LO Scan or a DR Scan), one or more of the clocks may be tuned to different values throughout the experiment. For example, the following is an excerpt from an LO scan in which the upconversion and downconversion LOs were each stepped by 250 MHz:
Index;ClockType;FreqMHz;Operation;Factor;HwKey;OutputNum
0;DownLO;40960;Multiply;8;Clock.0;1
0;UpLO;11520;Multiply;2;Clock.0;0
0;DRClock;7000;Multiply;1;Clock.0;2
1;DownLO;41210;Multiply;8;Clock.0;1
1;UpLO;11770;Multiply;2;Clock.0;0
1;DRClock;7000;Multiply;1;Clock.0;2
2;DownLO;41460;Multiply;8;Clock.0;1
2;UpLO;12020;Multiply;2;Clock.0;0
2;DRClock;7000;Multiply;1;Clock.0;2
3;DownLO;41710;Multiply;8;Clock.0;1
3;UpLO;12270;Multiply;2;Clock.0;0
3;DRClock;7000;Multiply;1;Clock.0;2
4;DownLO;41960;Multiply;8;Clock.0;1
4;UpLO;12520;Multiply;2;Clock.0;0
4;DRClock;7000;Multiply;1;Clock.0;2
The Index column refers to each step of the experiment. ClockType identifies the particular clock role (UpLO, DownLO, AwgRef, DRClock, DigRef, or ComRef). FreqMHz is the logical clock frequency in MHz. Operation (Multiply or Divide) and Factor account for any frequncy divider or multiplier on the clock output, and these values are used by Blackchirp to determine how to convert the logical frequencies into hardware frequency. HwKey and OutputNum tell which piece of hardware was used and which output (in the event that the clock has multiple outputs).
hardware.csv
This file contains the list of hardware compiled into Blackchirp when the experiment was performed. It is used in the program to determine whether it is possible to perform a Quick Experiment, which can be done only if the same hardware configuration is available. Example:
key;subKey
AWG.0;awg70002a
Clock.0;valon5009
Clock.1;fixed
FtmwDigitizer.0;dsa71604c
PulseGenerator.0;qc9528
The key and subKey fields together record which specific hardware implementation was used for each piece of hardware. The number of items in this list may be variable depending on your configuration.
header.csv
This file contains the vast majority of the program, acquisition, and hardware settings for the experiment. Essentially, any setting in effect at the beginning of the experiment that cannot change during the experiment is stored here. Example:
ObjKey;ArrayKey;ArrayIndex;ValueKey;Value;Units
ChirpConfig;;;ChirpInterval;30;μs
ChirpConfig;;;PostGate;-0.17;μs
ChirpConfig;;;PostProtection;0.15;μs
ChirpConfig;;;PreGate;0.5;μs
ChirpConfig;;;PreProtection;0.1;μs
ChirpConfig;;;SampleInterval;6.25e-05;μs
ChirpConfig;;;SampleRate;16000;MHz
Experiment;;;BCBuildVersion;v0.1-337-g4748747;
Experiment;;;BCMajorVersion;1;
Experiment;;;BCMinorVersion;0;
Experiment;;;BCPatchVersion;0;
Experiment;;;BCReleaseVersion;alpha;
Experiment;;;BackupInterval;0;hr
Experiment;;;Number;270;
Experiment;;;TimeDataInterval;5;s
FtmwConfig;;;ChirpOffset;-1;μs
FtmwConfig;;;ChirpScoringEnabled;false;
FtmwConfig;;;Objective;10000;
FtmwConfig;;;PhaseCorrectionEnabled;true;
FtmwConfig;;;TargetShots;10000;
FtmwConfig;;;Type;Target_Shots;
There are 6 columns in total. ObjKey identifies the “object” associated with an entry. This is a concept internal to Blackchirp, but the object names are usually sufficiently descriptive. In the example above, the FtmwConfig entries are associated with the settings pertaining to the CP-FTMW acquisition. ValueKey, Value, and Units together record the value and any associated units for the particular entry being made.
ArrayKey and ArrayIndex are used when there are multiple instances of data that would otherwise have the same ValueKey. For example, a PulseGenerator object may have several channels, each one of which has an associated delay, width, etc. An example of such a situation is:
PulseGenerator.0;;;RepRate;2;Hz
PulseGenerator.0;Channel;0;ActiveLevel;ActiveHigh;
PulseGenerator.0;Channel;0;Delay;50;μs
PulseGenerator.0;Channel;0;Enabled;true;
PulseGenerator.0;Channel;0;Name;Gas;
PulseGenerator.0;Channel;0;Role;Gas;
PulseGenerator.0;Channel;0;Width;170;μs
PulseGenerator.0;Channel;1;ActiveLevel;ActiveHigh;
PulseGenerator.0;Channel;1;Delay;0;μs
PulseGenerator.0;Channel;1;Enabled;false;
PulseGenerator.0;Channel;1;Name;DC;
PulseGenerator.0;Channel;1;Role;DC;
PulseGenerator.0;Channel;1;Width;160;μs
PulseGenerator.0;Channel;2;ActiveLevel;ActiveHigh;
PulseGenerator.0;Channel;2;Delay;660;μs
PulseGenerator.0;Channel;2;Enabled;true;
PulseGenerator.0;Channel;2;Name;AWG;
PulseGenerator.0;Channel;2;Role;AWG;
PulseGenerator.0;Channel;2;Width;20;μs
Here there is an ArrayKey named “Channel” and the ArrayIndex identifies which particular channel is referred to. That channel is associated with multiple different ValueKey entries, so the ArrayKey, ArrayIndex, and ValueKey would be used together to identify any desired value.
log.csv
This file contains a record of all messages sent to the Log tab during the experiment. Example:
Timestamp;Epoch_msecs;Code;Message
Wed Jul 13 14:36:46 2022;1657748206527;Highlight;Starting experiment 38.
Wed Jul 13 14:37:06 2022;1657748226794;Highlight;Experiment 38 complete.
The Timestamp and Message columns are self-explanatory. Epoch_msecs is the number of milliseconds since the Unix epoch. Code contains the level of the message: Normal, Highlight, Warning, Error, or Debug.
objectives.csv
This file is used internally by Blackchirp to configure data structures when the experiment is opened with the “View Experiment” dialog.
Warning
Modifying this file and then trying to load the experiment with Blackchirp may cause an error or crash.
version.csv
This file stores information about the Blackchirp version used with the experiment. The purpose is to enable the possibility of future backward compatability. An example:
;
key;value
BCMajorVersion;1
BCMinorVersion;0
BCPatchVersion;0
BCReleaseVersion;alpha
BCBuildVersion;v0.1-355-gcfb2832
The first line contains the separator character used for all of the CSV files associated with this experiment. The second line tells the titles of the columns (key and value, respectively). The subsequent lines contain the detailed Blackchirp version information.
FIDs
Like other files, FIDs are stored in plain-text CSV format. The FIDs for an experiment are located in a fid subfolder within the experiment folder. FIDs themselves are in a set of numbered CSV files starting from 0. In addition, there is a fidparams.csv file that contains useful information.
fidparams.csv
This file contains information needed to convert raw FID data into numerical values, as well as the information needed to determine the appropriate frequency values following a Fourier transform. Here is an example fidparams.csv file that corresponds to the clocks.csv file shown above for an LO scan:
index;spacing;probefreq;vmult;shots;sideband;size
0;2e-11;40960;0.0009765625;200;LowerSideband;500000
1;2e-11;41210;0.0009765625;174;LowerSideband;500000
2;2e-11;41460;0.0009765625;100;LowerSideband;500000
3;2e-11;41710;0.0009765625;100;LowerSideband;500000
4;2e-11;41960;0.0009765625;100;LowerSideband;500000
In this example, there were 5 unique clock configurations, and 100 shots were recorded at each position. Following one complete sweep, the program returned to the first configuration and acquired 100 additional shots. The acquisition was aborted after 74 shots on the second step of the second sweep.
The index column identifies a particular FID and the number of its corresponding CSV file. In this example, there are 5 FIDs: the first is 0.csv, the next is 1.csv, and so on. The size column tells the number of points in the FID.
In its FID files, Blackchirp does not store the averaged digitizer voltage. Instead, Blackchirp stores the sum of the raw digitizer readings. To convert the FID values to average voltage, the numbers in the FID file need to be multiplied by vmult and divided by shots. The vmult column contains the conversion between digitization levels and voltage, while shots contains the number of digitizer readings that have been summed.
Finally, for calculating the frequency axis of the FT, the spacing tells the time between samples in seconds; the probefreq tells the downconversion LO frequency in MHz, and sideband tells whether the FT frequency should be added (UpperSideband or 0) or subtracted (LowerSideband or 1) from the probefreq.
FID CSV Files
In an effort to balance plaintext readability, ease of integration with other analysys software, and file size, the summed digitizer values are written as base-36 signed integers. A simple example may begin with:
fid0
-7n
-k
10
-p
-21
6j
-8o
-2v
4c
-2x
-1s
-11
The first row is a column label, and each subsequent row contains a single FID point (e.g., -7n = -275). In some configurations, the FID file may contain data from multiple frames, as shown in the example below which has 20 FIDs (only the first 9 points for each FID are shown):
fid0;fid1;fid2;fid3;fid4;fid5;fid6;fid7;fid8;fid9;fid10;fid11;fid12;fid13;fid14;fid15;fid16;fid17;fid18;fid19
-33;-1u;-22;7z;-4r;-4r;36;-4t;-r;2m;-as;-bk;1g;-8j;-3u;-50;-73;-b1;1u;-5s
-w;-5v;-4p;7u;-br;-2j;-2n;-7h;-3v;-8z;-5t;-89;-5p;-be;23;-4e;q;-2l;-4a;-ck
4g;-5f;2t;h;-i9;-a3;-d1;-r;-n;-hg;6c;-4p;-k1;-99;-31;-2z;-6i;-a0;-3w;-bw
32;-cr;i;-9q;-b4;-bi;-2w;4c;5s;-iv;72;-7m;-7a;-2j;-6s;-cj;-77;-hj;2z;-e5
-22;-l9;-72;-af;-82;4;-3j;-6a;-8e;-9l;-59;-2g;3n;m;-ch;-el;-l;-f7;-e;-gc
-4o;-fi;-2e;-c0;-bk;58;-8w;-dj;-bo;-2z;-7v;6d;-6p;-6f;-i2;-8p;-8l;-au;-49;-68
-5o;-3p;-9;-bv;-cu;-3e;2v;-6c;-1y;1j;-6v;5b;-2x;-9f;-dl;-4y;-ex;-2f;-3o;-8
-az;-33;-99;-4r;-ee;-9p;-8e;-2l;-dk;56;-fq;-3t;38;3a;-7f;-4a;-2b;3m;-e;-4t
-bg;-82;-6s;-7r;-8k;-3o;-id;-2j;-i9;3f;-gw;-7c;-6b;-r;-57;-4v;-2o;-h;-3r;-20
processing.csv
This file contains the default processing settings associated with the FID data. An example is shown below.:
ObjKey;Value
AutoscaleIgnoreMHz;250
FidEndUs;10
FidExpfUs;0
FidRemoveDC;true
FidStartUs;5
FidWindowFunction;None
FidZeroPadFactor;0
FtUnits;6
The FtUnits value refers to a scaling factor of 10N (i.e., a setting of 6 would convert the FT from units of V to μV.). The window functions are shown below, where N is the number of samples and n ranges from 0 to N-1:
None/Boxcar (0)
Bartlett (1)
Blackman (2)
BlackmanHarris (3)
Hamming (4)
Hanning (5)
KaiserBessel (6). I0 = regular modified cylindrical Bessel function, β=14.0
Overlays
When overlays are created for an experiment, their data and settings are automatically saved in an overlays subfolder within the experiment directory. This allows overlays to be restored when the experiment is reopened. The overlay storage system uses a combination of CSV files to preserve both the overlay data and all configuration settings.
overlays.csv
This master file contains the list of all overlays associated with the experiment and tracks which overlays are currently active. Each overlay is identified by its label, and the value indicates the overlay type: 0 = Blackchirp Experiment, 1 = Catalog, 2 = Generic XY Data. The file also stores version information for compatibility tracking. Example:
ObjKey;Value
1012;2
2638;0
BCBuildVersion;v1.0.0-release-134-g0d7631d
BCMajorVersion;1
BCMinorVersion;1
BCPatchVersion;0
BCReleaseVersion;devel
Exp17;0
c047527_full;1
Individual Overlay Files
For each overlay listed in overlays.csv, two additional files are created:
- [label].settings.csv
Contains all configuration parameters for the overlay, including:
Source file path and overlay type-specific settings
Curve appearance properties (color, line style, thickness, visibility)
Data processing parameters (scaling, offsets, frequency filtering)
Plot assignment and display preferences
Version information for compatibility
Example for a catalog overlay:
ObjKey;Value
catalogConvolutionEnabled;false
catalogLineshapeType;1
catalogLinewidthKHz;100
catalogTransitionCount;87
curve_color;#40963a
curve_thickness;2
enabled;true
label;c047527_full
sourceFile;/path/to/catalog.cat
yScale;-25056766.9100865
- [label].data.csv
Contains the processed overlay data ready for display, with columns for frequency (X) and intensity (Y) values. The data format varies by overlay type:
Catalog overlays: Contains frequencies and intensities of peaks, along with other transition metadata (quantum numbers, etc).
Generic XY overlays: Contains the parsed and filtered XY data from the source file
Blackchirp Experiment overlays: Contains the Fourier transform data from the referenced experiment
The data files use standard CSV format with semicolon separators, maintaining consistency with other Blackchirp data files.
Storage Benefits
This overlay storage system provides several advantages:
Session Persistence: Overlays are automatically restored when reopening experiments
Reproducibility: All settings and source file references are preserved
Portability: Overlays are bundled with the experiment and can be loaded on other computers
Version Compatibility: Version tracking enables future backward compatibility
Performance: Cached data files enable fast overlay loading without reprocessing
The overlay storage follows Blackchirp’s standard CSV format conventions, ensuring the data remains accessible and human-readable while maintaining compatibility with external analysis tools.