Application Log
The Log tab displays the running stream of messages produced by Blackchirp during a session. Messages come from the application core, the acquisition engine, and individual hardware drivers; together they form a continuous record of what the program is doing.
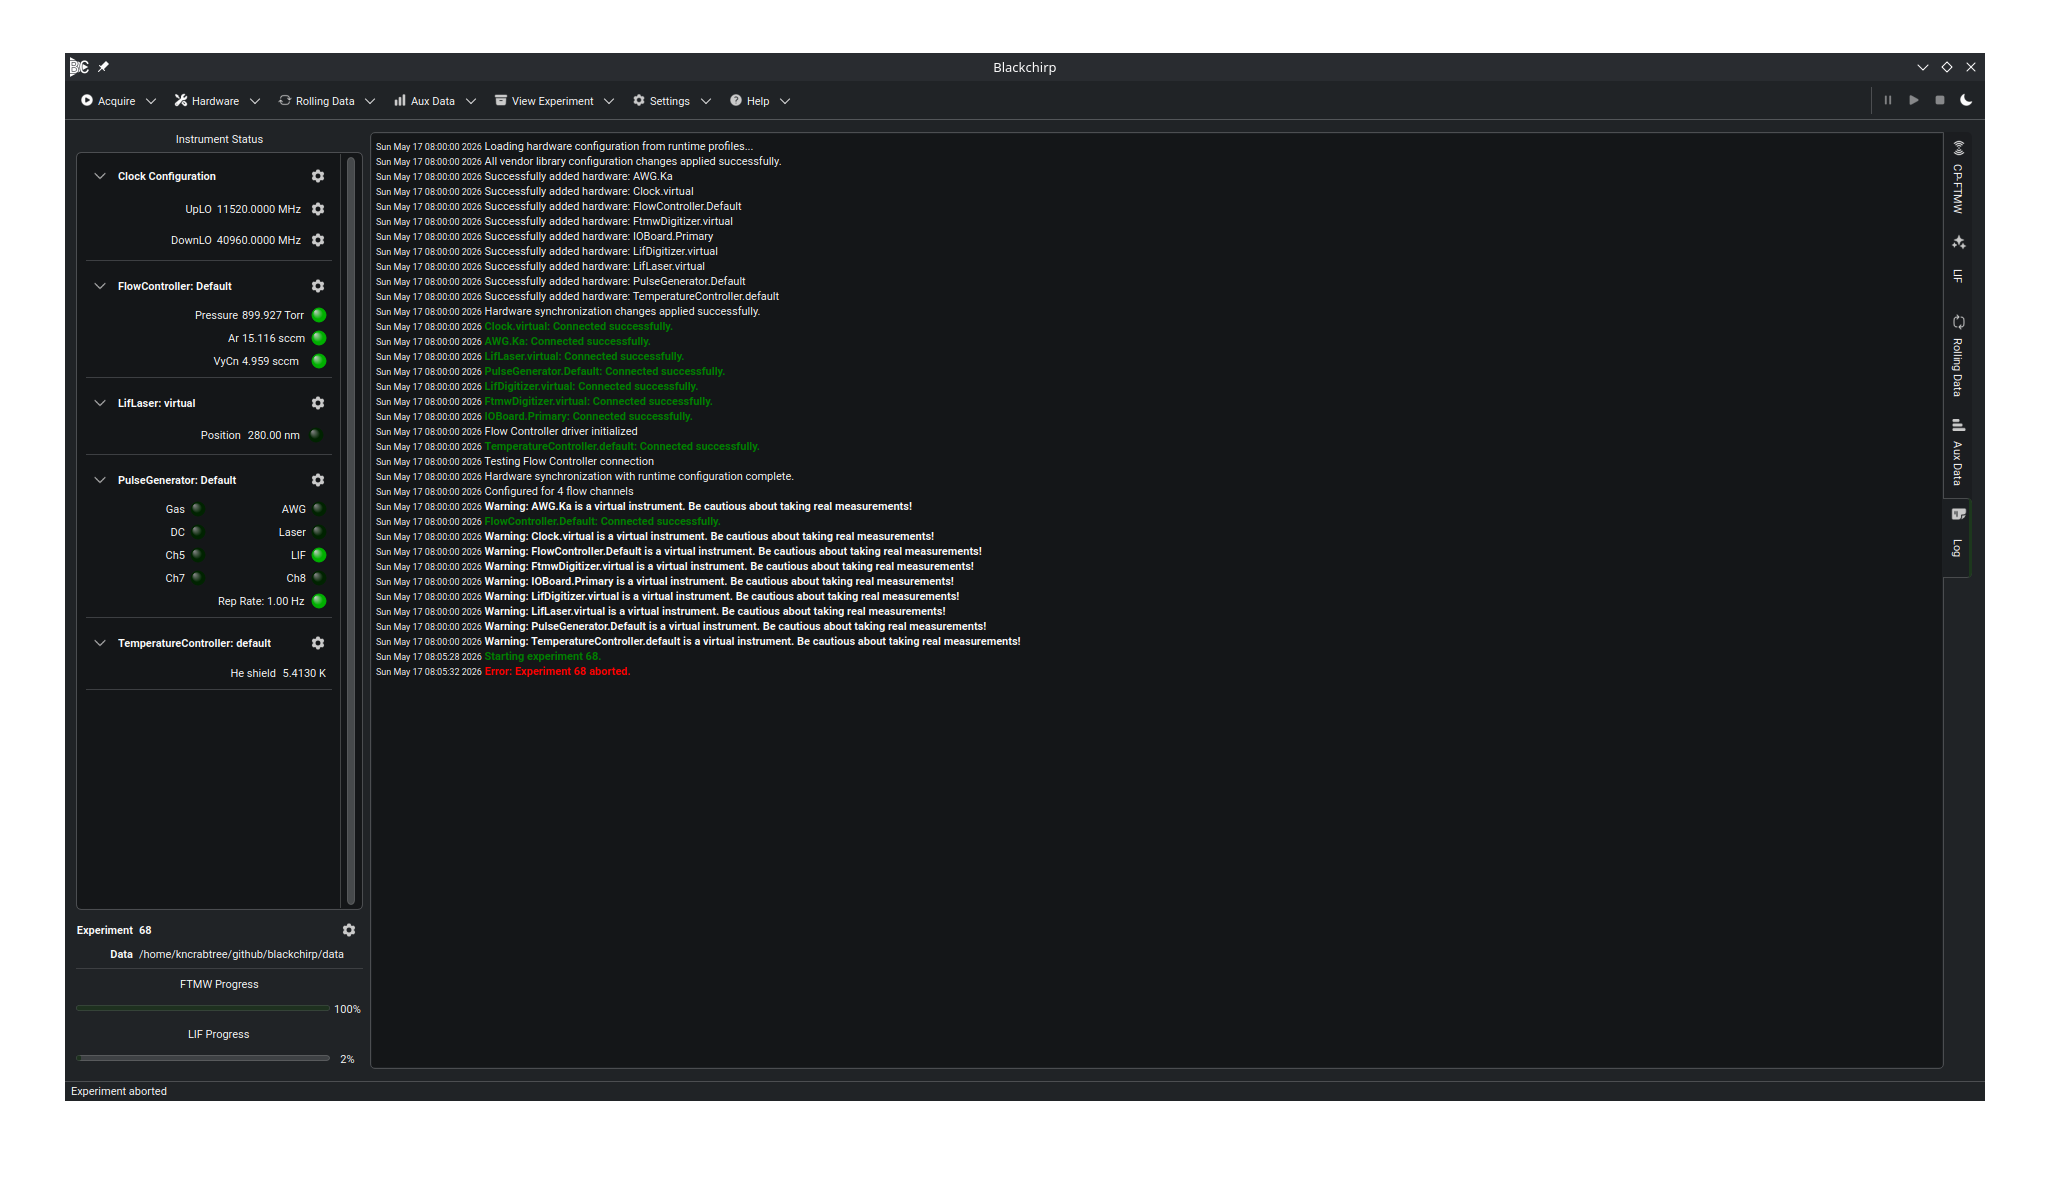
The Log tab during a session that mixes routine status messages, bold-green highlight markers around experiment activity, and bold warning and error entries.
The Log tab is a read-only text view that scrolls as new messages arrive. While another tab is active, the Log tab’s title shows a counter of unread messages. Switching to the Log tab clears the counter.
Message Severity
Every message carries one of five severity labels. The label determines how the message is rendered in the Log tab and how it is recorded on disk.
- Normal
Routine informational status messages. Rendered in the default font.
- Highlight
Important state transitions, such as experiment start and end markers. Rendered in bold green to make them easy to spot in a long log.
- Warning
Recoverable problems that do not stop acquisition. Rendered in bold.
- Error
Failures that require attention. Rendered in bold red. When an error message is logged, the Log tab’s title gains an alert icon so the error is visible even when another tab is active.
- Debug
Diagnostic detail intended for troubleshooting. Debug messages are suppressed entirely unless the runtime debug-logging toggle is enabled (see Debug Logging). Even when enabled, debug messages are written only to a separate file and never appear in the Log tab.
Message Sources
All parts of Blackchirp write to the same log stream, so the Log tab shows everything in chronological order:
The application core reports startup, configuration changes, and general status.
The acquisition engine reports experiment start, completion, per-segment progress, and any processing errors.
Hardware drivers report connection status, commands sent, and responses received. Each hardware message is prefixed with the device’s hardware key, making it straightforward to identify which instrument produced a message.
Runtime Debug Logging
Debug-level messages are disabled by default. To enable them, open the Application Settings dialog (Settings → Application Settings) and check the Debug Logging option. See Debug Logging for details.
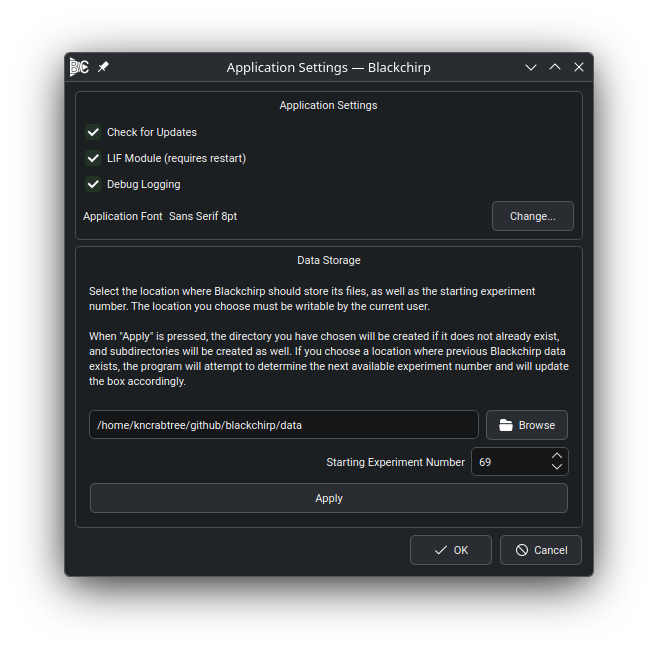
The Debug Logging option in the Application Settings dialog.
When debug logging is enabled, Blackchirp writes debug-level messages to a
separate debug_YYYYMM.csv file in the log directory. The setting persists
across restarts and takes effect immediately — no restart is required.
On-Disk Log Files
Blackchirp writes log messages to disk automatically. Log files are stored in
the log/ subdirectory of the Data Storage Location (see
Data Storage).
- Monthly log files
One file per calendar month, named
YYYYMM.csv(for example,202604.csv). All messages with severity Normal, Highlight, Warning, or Error are appended to this file as they arrive.- Monthly debug log files
When debug logging is enabled, a parallel
debug_YYYYMM.csvfile in the same directory collects the Debug-severity stream. This file is not created when debug logging is disabled.- Per-experiment log
While an experiment is running, every log message (Normal through Error) is also appended to a
log.csvfile inside that experiment’s folder. Each experiment therefore carries a self-contained record of what happened during its acquisition. See Data Storage for the layout of experiment folders.
All log files are semicolon-delimited CSV with four columns:
Timestamp;Epoch_msecs;Code;Message
The Timestamp column contains a human-readable date and time string. The
Epoch_msecs column contains the Unix epoch time in milliseconds, which is
convenient for sorting or aligning data in analysis tools. The Code column
contains the severity label (Normal, Highlight, Warning, Error,
or Debug). The Message column contains the full message text.