User Interface Overview
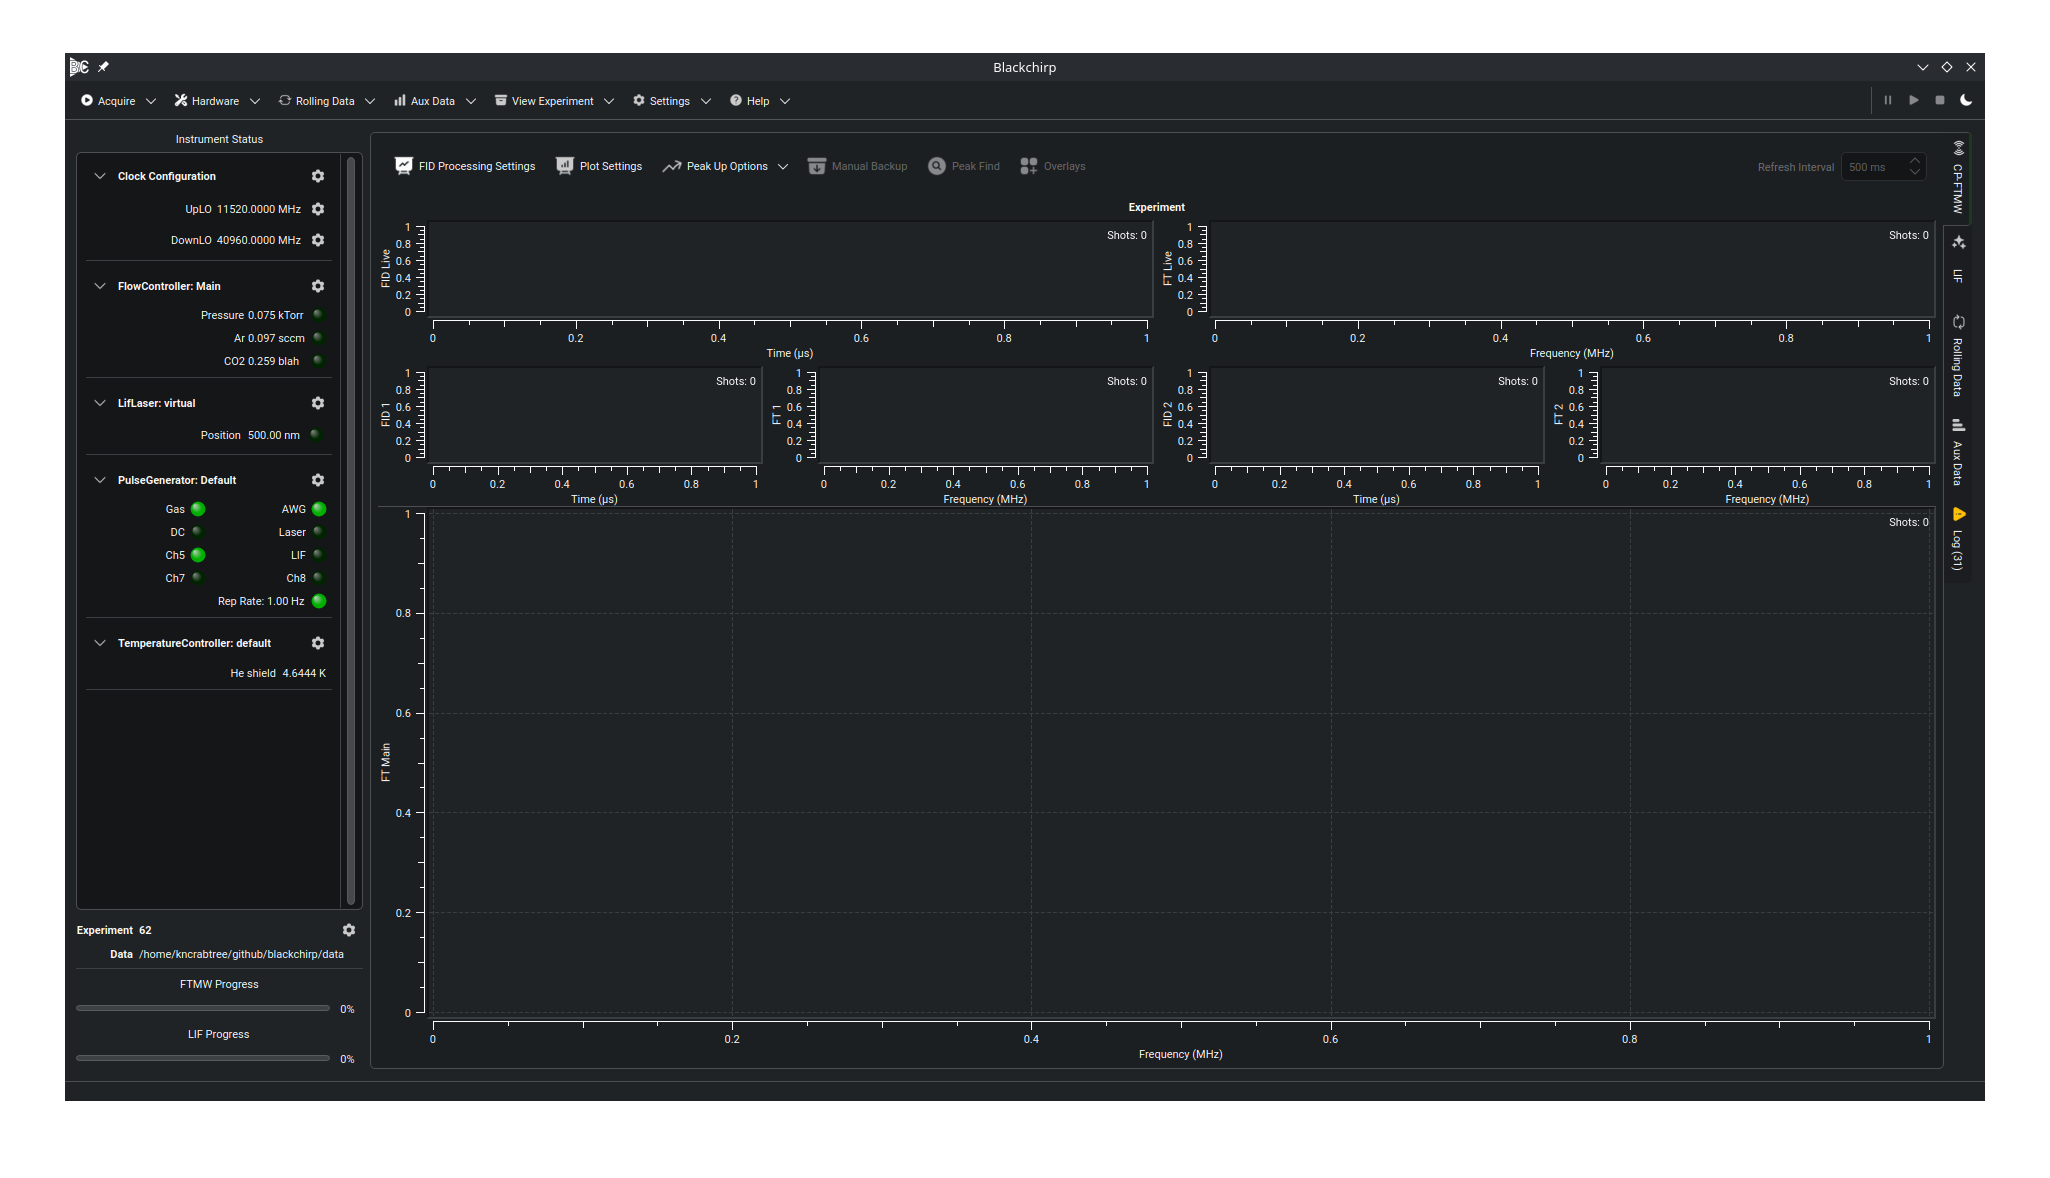
The Blackchirp main window. The main toolbar runs across the top, the instrument status panel anchors the left side, and the tabbed display area fills the center.
Main Toolbar
The main toolbar runs across the top of the window and holds most of the program-level controls. Some entries are disabled depending on the current program state.
Acquireopens a menu with options for initiating a new experiment.Start Experiment(hotkey: F2) opens a wizard for fully configuring a new experiment.Quick Experiment(hotkey: F3) allows repeating a previous experiment or initializing the “Start Experiment” wizard with settings from a previous experiment.Start Sequenceperforms a series of identical experiments with a time delay in between.
Hardwareopens a menu that provides access to hardware controls, communication settings, loadout and preset switching, and per-device dialogs. These are discussed in detail on the Hardware Menu page.Rolling DataandAux Dataare menus with settings pertaining to the Rolling/Aux Data tabs. Here you can control the number of plots on each tab and, for rolling data, the minimum amount of retained history.View Experimentloads and displays any previously-completed experiment in a new window. The dialog offers a list of recently-opened experiments and remembers the last directory browsed; the same recent list is also available from theOpen Recentsubmenu of theView Experimenttoolbar button.Settingscontains miscellaneous program settings, including the program Data Storage Location.Helpopens a menu with links to online resources and the About dialog (see Help Menu below).
On the far right are additional controls that are most relevant during an acquisition:
Pausesuspends data processing during an active experiment. FIDs arriving from the FTMW digitizer are discarded and no Aux Data is recorded while the acquisition is paused.Resumecontinues data processing after a pause.Abortterminates an ongoing acquisition. ForPeak UpandForeverFTMW modes,Abortis the normal way to stop the experiment.Sleepplaces Blackchirp and its hardware into a standby state; pressing it during an acquisition defers the transition until the experiment completes. Each driver interprets sleep mode in its own way: a PulseGenerator stops generating pulses; a FlowController shuts off all gas flows while continuing to monitor the actual flow rates; other hardware objects do nothing.
Instrument Status
The left panel is the instrument status panel. Each item in it is a collapsible status box with a title row and a body region. The title row contains:
A collapse/expand toggle button (chevron icon).
A bold title label showing the hardware key (
Type.Label) of the associated device, or a fixed label for non-device boxes.A configure button (cog icon). For most status boxes it opens the Hardware Dialog for the associated device, equivalent to selecting that device from the Hardware menu. A few variants override this target — see the variant entries below.
Status boxes are added and removed when the active hardware map changes (see Loadouts). Only devices in the active loadout have status boxes; a status box is grayed out while its device is offline.
Experiment info panel
Exptdisplays the last experiment number in the current save directory, or 0 if no experiments have been performed. The number increments upon successful initialization of an experiment.FTMW Progressshows the completion percentage of an ongoing FTMW acquisition.LIF Progressshows the completion percentage of an ongoing LIF acquisition (visible only when the LIF module is enabled).
Status box variants
Each variant appears when its hardware type is in the active loadout.
- Clock Display Box
Shows the current logical clock frequencies (UpLO, DownLO, AwgRef, DRClock, DigRef, ComRef) configured in the RF chain. Each row names the clock role, its physical hardware assignment, and the most recent frequency reading. The title-bar configure button opens the FTMW Configuration dialog rather than a single device dialog, because clock roles are mapped to hardware there; a separate cog icon next to each row opens the Hardware Dialog for that row’s physical clock device.
- Gas Flow Display Box
Displays the measured flow rate and setpoint for each gas channel, the channel enable state (LED), and the inlet pressure reading and pressure control mode.
- Pressure Status Box
Shows the most recent chamber pressure reading and an LED indicating whether pressure control is active.
- Pulse Status Box
Shows one LED per pulse channel for its current enabled state, the global pulse-generator enable LED, and the repetition rate. Channel labels and tooltips reflect the channel names and timing parameters stored in settings.
- Temperature Status Box
Shows the most recent temperature reading for each enabled channel, labeled by channel name. Channels that are disabled in settings are hidden; a placeholder message appears when no channels are enabled.
- LIF Laser Status Box
Shows the current laser position (wavelength or delay, depending on the driver) and a flashlamp enable LED. Appears only when the LIF module is also enabled.
Display Tabs
The tabbed area in the center of the window holds the live data and status views.
CP-FTMWshows the free-induction decay and Fourier transform from an ongoing or just-completed experiment. See Viewing FTMW Data for plot and toolbar details.LIFshows data from an ongoing or just-completed LIF experiment. See Viewing LIF Data. The tab is present only when the LIF module is enabled.Rolling DataandAux Dataplot signals from hardware as a function of time. Rolling data is acquired continuously while Blackchirp is open; Aux data is recorded only during an experiment. See Rolling/Aux Data.Logshows program messages. The number of unread messages since the tab was last viewed appears in parentheses; warnings raise a yellow-triangle icon on the tab, errors a red-and-white X icon. See Application Log for the message taxonomy and on-disk format.